Financial Decks
Visualize your results with ease
Charts template for Powerpoint in the form of ribbons
from deck
Flat Data-Driven Presentation Charts (PPT template)
Info
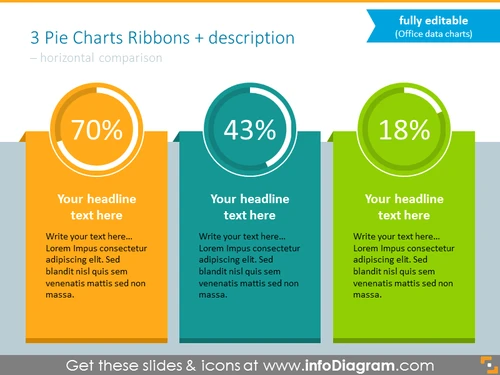
3 Pie Charts Ribbons + description
Slide Content
The slide presents a comparison between three different data points using pie charts, each with a corresponding ribbon shape and descriptive text. The first pie chart shows a 70% data point, suggesting a significant portion of an entity or metric. The second chart displays a 43% figure, indicating a smaller segment relative to the first. The third chart has an 18% data point, highlighting the smallest share among the compared elements. Below each pie chart is a placeholder for a headline and additional text for a more detailed explanation.
Graphical Look
- Three large pie chart graphics aligned horizontally, each illustrating a percentage with a bold number and encircled by a colored ring.
- Each pie chart is a different color: orange for 70%, teal for 43%, and green for 18%.
- A large ribbon shape emerges behind each pie chart, matching the colors of the pie charts and providing space for text.
- Placeholder text boxes for a headline and description are positioned below each chart.
- The overall design is bold and colorful with a strong contrast that makes the charts stand out.
The overall look of the slide is modern and engaging, with a clean layout that directs attention to the key data points highlighted by the vibrant pie charts and their accompanying ribbons.
Use Cases
- Presenting key performance indicators (KPIs) in business reviews or team meetings to compare metrics such as market share, customer satisfaction, or departmental performance.
- Visualizing and comparing research data results in academic or market research presentations, where visual appeal can enhance audience engagement and understanding.
- Showing progress on different project milestones in project management updates, where each portion represents the completion status of a particular phase.
- Comparing product sales, market penetration, or demographic segments in sales and marketing presentations, offering an instant visual comparison of important statistics.


