Financial Decks
Visualize your results with ease
Pipe flow diagram with input split to five outputs
from deck
Outline Diagrams - Ultimate Deck for Visual Presentations (PPT graphics)
Info
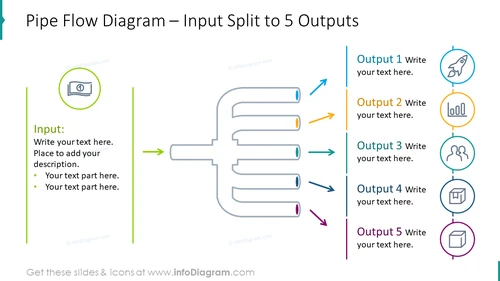
Pipe Flow Diagram – Input Split to 5 Outputs
Slide Content
The slide presents a visual representation of a process flow, specifically a "Pipe Flow Diagram" where a single input is split into five distinct outputs. Each output is represented by a differently colored arrow pointing towards a circular icon with a symbol inside, signifying the nature or category of the output. Bullet points suggest that additional descriptive text can be placed for the input as well as for each output.
Graphical Look
- The slide features a large central graphic depicting a stylized pipe system.
- The pipes are aligned horizontally with gray outlines, indicating fluid or data flow from left to right.
- On the left, there's a single input pipe with a green arrow, incorporating a placeholder for text and a circular icon suggesting a measurement instrument.
- This input pipe branches into five outputs, each featuring a colored arrow (blue, orange, teal, black, and purple) pointing to a labeled circular icon on the right side.
- The icons at the outputs include representations of a rocket, a bar graph, social connections, a document, and a presentation slide.
- Each output has a corresponding text box for additional information.
- The design employs simple, clean lines and flat icons for a modern and professional appearance.
The overall look is both colorful and organized, with intuitive imagery that simplifies complex information. The professional layout easily conveys the idea of a singular process branching into multiple distinct outcomes.
Use Cases
- To explain how a single project or initiative leads to multiple results or products.
- For visualizing different business divisions or teams that stem from a central corporate strategy.
- To illustrate how one research finding can have implications across multiple scientific disciplines.
- In management meetings to demonstrate how resources are allocated to different departments or projects.


