Financial Decks
Visualize your results with ease
Editable diagrams
from deck
Plane Flight Timeline Diagrams (PPT Template)
Info
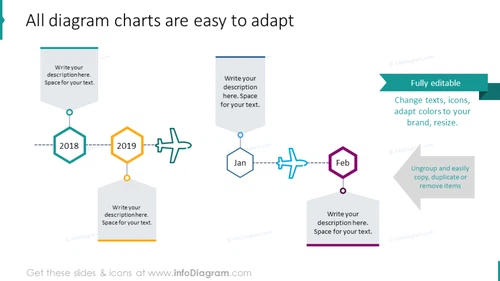
All diagram charts are easy to adapt
Slide Content
The PowerPoint slide presents a timeline or process flow with customizable elements for each year or step. Beginning with the year "2018" marked by a green hexagon, followed by "2019" indicated by an orange octagon, and moving on to "Jan" and "Feb" signified by a blue and purple plane shapes respectively, each part of the timeline has space for text descriptions to convey specific information or status about that point in time.
Graphical Look
- The title is in a large, bold font at the top of the slide.
- A dotted line serves as the timeline, connecting different shapes.
- Four distinct icons—a green hexagon, an orange octagon, a blue cross, and a purple diamond shape—represent points on the timeline.
- Each icon is associated with a text box for descriptions, aligned with respect to the icons' positions.
- Text boxes on the left and right sides feature instructions for customization.
- The color palette includes greens, blues, oranges, and purples for a visually harmonious look.
- The slide's background is white, ensuring that the icons and text are prominent.
The slide exhibits a clean and professional design, with easily readable text and vibrant colors that highlight the key elements. Icons and shapes provide a visual guide for the timeline, aiding in the sequential representation of information.
Use Cases
- To illustrate a company's historical milestones or significant achievements over time.
- For project managers to outline the phases of a project with deadlines and deliverables.
- In business strategy presentations to depict the roll-out of new initiatives, campaigns, or product launches.
- To showcase the timeline of events in a graphical way during training or informational sessions.


