Financial Decks
Visualize your results with ease
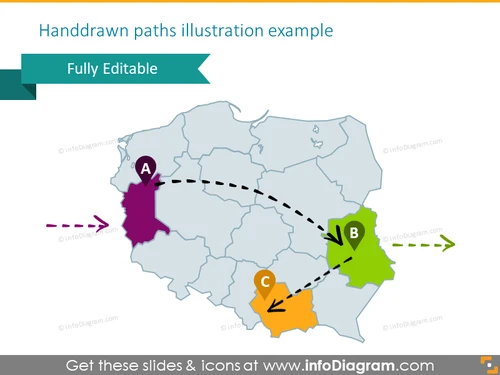
Example of the Poland map illustrated with handdrawn paths
from deck
Poland Maps with Regions - Voivodeships Divisions (PPT Template)
Info
Handdrawn paths illustration example
Slide Content
The slide titled "Handdrawn paths illustration example" appears to showcase a stylized map demonstration, highlighting routes or connections between three distinct areas labeled A, B, and C. Area A is connected to B with a dashed line signifying a path, while Area B is connected to C, indicating a sequence or a flow of information or movement. This example slide is likely a part of a larger presentation aimed at discussing geographical relations or logistical operations.
Graphical Look
- A teal banner at the top with the text "Fully Editable" in white.
- A stylized map in light blue with outlines of regions.
- Three colored areas marked with letters "A," "B," and "C," with A in purple, B in green, and C in orange.
- Dashed lines showing paths between the areas: a purple dashed line leading from off-slide to A, a black dashed line from A to B, and another black dashed line from B to C.
- Directional arrows along the dashed lines indicating the direction of travel or movement: a purple arrow pointing to A, black arrows on the lines between A, B, and C.
- Iconic representations for points A (pin marker), B (circle), and C (arrow).
The slide has a playful, hand-drawn aesthetic despite being digitally rendered, with vibrant colors and dashed lines that give a sense of movement or flow. The color-coding and distinct icons represent different stages or locations in a process or journey.
Use Cases
- Presenting the stages of logistical operations from one point to another.
- Explaining a multi-stage project process with geographical components.
- Illustrating the flow of information or goods across different regions.
- Teaching or discussing geographic regions and their connectivity in an educational setting.


