Financial Decks
Visualize your results with ease
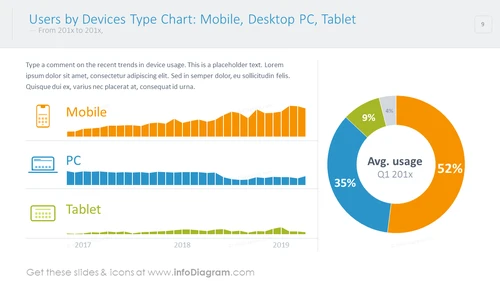
Users by devices type chart shown with circle and bar charts
from deck
Web Analytics Report Charts (PPT Template)
Info
Users by Devices Type Chart Shown With Circle and Bar Charts Diagram
Meaningful PowerPoint slide template characterizing webpage users according to their preferred device. An average device use can be displayed as a comparison in one editable pie chart or three adjacent area charts presenting detailed information on the usage over time.
What Does This Users by Devices Type Chart Shown With Circle and Bar Charts Diagram Include?
- 3 editable colorful area charts with icons
- colorful pie chart of average device usage
- flat icons of a mobile phone, smartphone, PC, computer, tablet
This Users by Devices Type Chart Shown With Circle and Bar Charts Diagram is a part of our Web Analytics Report Charts PPT Template.


