Financial Decks
Visualize your results with ease
Details on problem, solution, website metrics with graphics
from deck
Web Analytics Report Charts (PPT Template)
Info
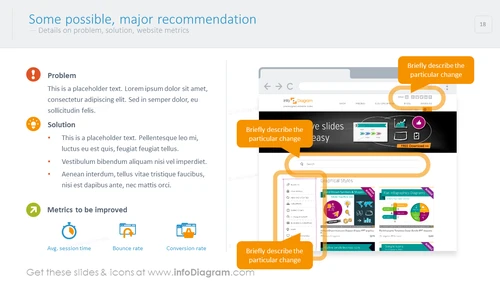
Details on Problem, Solution, Website Metrics With Graphics Slide
Visual analysis of a webpage created in the PowerPoint slide with a problem, solution, and metrics to be improved stages illustrated with editable graphic indicators. Place a screenshot of your webpage in the slide layout and use our visuals and icons to mark areas that need attention.
What Does This Details on Problem, Solution, Website Metrics With Graphics Slide Include?
- description area with text placeholders and meaningful graphics and icons
- print screen area with contour shapes for marking picture fragments and text containers for comments
- flat icons of an exclamation mark, problem, light bulb, idea, solution, arrow, rise, metrics, timer, period, bounce rate, webpage exits, online shop, basket, purchase
This Details on Problem, Solution, Website Metrics With Graphics Slide is a part of our Web Analytics Report Charts PPT Template.


