Financial Decks
Visualize your results with ease
Process Diagram
from deck
Sketchnoting Doodle Symbols (PPT icons and shapes)
Info
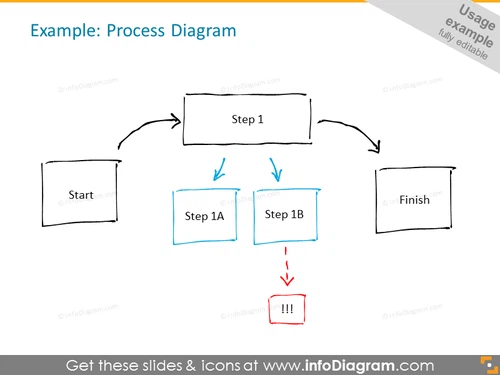
Example: Process Diagram
Slide Content
The slide is a visual representation of a process flow which includes a starting point, multiple steps, and a concluding step. "Start" marks the commencement of the process, leading to "Step 1" which is the first action to be executed. After "Step 1", the process bifurcates into "Step 1A" and "Step 1B", suggesting parallel or choice-making steps within the process. "Step 1B" is marked with a warning symbol indicating a potential issue or important consideration at that point. The flow concludes with "Finish" which signifies the end of the process.
Graphical Look
- The slide's title is in bold, larger font at the top.
- Five boxes representing different stages of a process flow are drawn with a hand-drawn effect.
- Arrows are used to show the direction of flow from one step to the next, some moving directly while others diverge or converge.
- Alternate steps ("Step 1A" and "Step 1B") are highlighted in blue and are connected by blue arrows, emphasizing their connection.
- A red warning symbol with exclamation points is placed next to "Step 1B", drawing attention to this particular step.
- The slide has an informal, sketched appearance, using simple black outlines for the shapes and arrows.
The slide has a casual, sketched look which gives it an informal and approachable vibe. The use of colors highlights specific parts of the process, drawing the audience's attention to them.
Use Cases
- Explaining step-by-step processes in team meetings or training sessions to outline workflows or guidelines.
- Presenting project roadmaps to stakeholders, showing different paths a project could take after a certain milestone.
- Highlighting potential risks or decisions required during a process in risk management or strategic planning discussions.
- Aiding in problem-solving discussions by mapping out a problem and identifying points where issues can occur or decisions are needed.


