Financial Decks
Visualize your results with ease
Product Distribution Pie Chart Binoculars Graphics
from deck
Creative Percentage Shares Pie Charts (PPT Template, data-driven)
Info
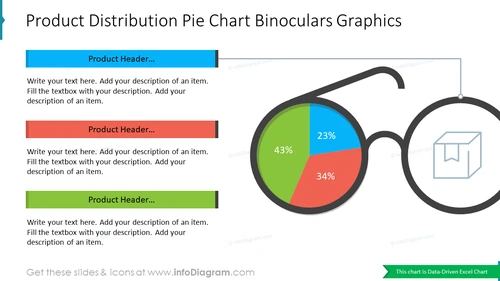
Product Distribution Pie Chart Binoculars Graphics
This PowerPoint slide template provides a visually engaging and informative way to present product distribution data. The pie chart, shaped like a pair of binoculars, effectively segments the market share of three different products. The binoculars graphic adds a creative touch, symbolizing the focused approach to analyzing and understanding product distribution. This slide can be used in various business presentations, such as market research reports, sales and marketing strategies, or product launch plans.
What Does This Product Distribution Pie Chart Binoculars Graphics Slide Include?
- An Excel-driven pie chart divided into three unequal segments, representing the market share of three products
- Each segment of the pie chart is labeled with a product header and percentage value
- A binoculars graphic superimposed on the pie chart, with the eyepieces aligning with two of the pie chart segments
- Text boxes for adding descriptive details about each product
- A contrast color palette of blue, green, red and gray, creating a professional and visually appealing aesthetic
- An outline icon of a box, product, offer


