Financial Decks
Visualize your results with ease
Five product sales comparison chart with thin line title and icons
from deck
Bar and Column Chart Data-driven Graphics (PPT Template)
Info
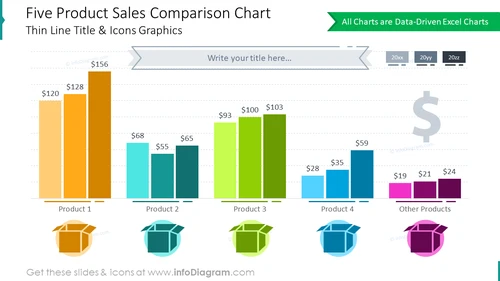
Five Product Sales Comparison Chart
Slide Content
The slide is titled "Five Product Sales Comparison Chart" and contains a bar chart comparing the sales of five different products. Each product has three bars representing sales data for three successive years (20xx, 20xy, 20xz). For example, Product 1 has sales figures for each year displayed above its bars, indicating a pattern of sales over time. Icons below the chart visually represent each product, supporting quick identification and adding a graphical element to the data.
Graphical Look
- The title of the slide is in a large, bold font, contrasting with the subtitle which is thinner and less prominent.
- A bar chart dominates the slide, with five sets of triple bars in different colors representing different products.
- Numerical sales values are placed above each bar for quick reference.
- Three colorful icons are placed below the chart, correlated with their respective product bars.
- An area at the upper right corner provides space for the audience to write their title, flanked by a green ribbon stating "All Charts are Data-Driven Excel Charts".
- A large dollar sign is positioned to the right of the chart, likely symbolizing the financial context of the data.
- A timeline across the top of the bar chart indicates three different years for the sales data.
- The overall color scheme includes varying shades of blue, green, orange, and purple, corresponding to the different products.
The slide has a clean, professional appearance with a clear focus on the comparative sales data. The use of color and icons aids in visual association and data comprehension.
Use Cases
- Presenting annual sales data for multiple products in a business meeting to highlight trends and performance over time.
- Comparing financial performance of different products during a strategic planning session.
- Demonstrating sales growth or decline of product lines to stakeholders in an annual report presentation.
- Using in a marketing presentation to showcase which products are the best sellers and which may need additional marketing efforts. I'm sorry, but there seems to be a misunderstanding. There are no images attached for me to provide the information you requested. Please attach the image and I will be happy to help you with the description and use cases.


