Financial Decks
Visualize your results with ease
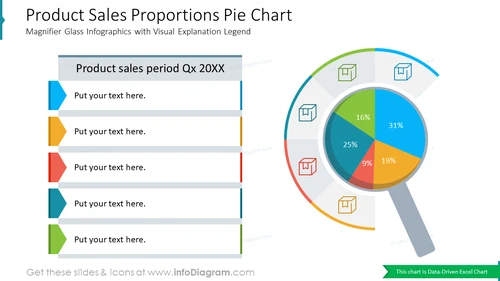
Product Sales Proportions Pie ChartMagnifier Glass Infographics with Visual Explanation Legend
from deck
Creative Percentage Shares Pie Charts (PPT Template, data-driven)
Info
Product Sales Proportions Pie Chart Magnifier Glass Infographics with Visual Explanation Legend
This PowerPoint slide provides a visually engaging and informative representation of product sales proportions using a pie chart, magnifying glass icon, and explanatory text. It is an ideal tool for showcasing sales data in a clear and concise manner, making it suitable for various business presentations, including sales reports, marketing strategies, and product performance reviews.
What Does This Product Sales Proportions Pie Chart Magnifier Glass Infographics with Visual Explanation Legend Include?
- A prominent pie chart divided into five distinct color segments, each representing a specific product category and its corresponding sales proportion
- A magnifying glass icon positioned over the pie chart, emphasizing the focus on analyzing and understanding sales distribution
- Accompanying text boxes providing detailed explanations of the pie chart segments and their respective sales percentages
- An outline icon of a box, product, offer


