Financial Decks
Visualize your results with ease
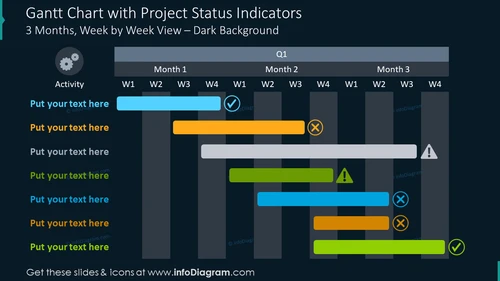
Gantt chart with project status indicators on dark background
from deck
Gantt Chart Graphics for Project Planning (PPT Template)
Info
Gantt Chart With Project Status Indicators on Dark Background Template
An elegant yearly Gannt diagram for marking 7 projects over the following months and weeks. Use it to discuss project development in your company, indicating the status and importance with specific colors and icons. Highlight risks with meaningful icons. Learn more about the Gannt chart on Wikipedia.
What Does This Gantt Chart With Project Status Indicators on Dark Background Template Include?
- Calendar table presenting 7 projects over the following 12 months divided into quarters and weeks
- Editable colorful project markers
- Outline icons of a check mark and a cross mark
- Flat icon of an exclamation mark, issue, risk, process, development, gears
This Gantt Chart With Project Status Indicators on Dark Background Template is a part of our Gantt Chart Graphics for Project Planning PPT Template.


