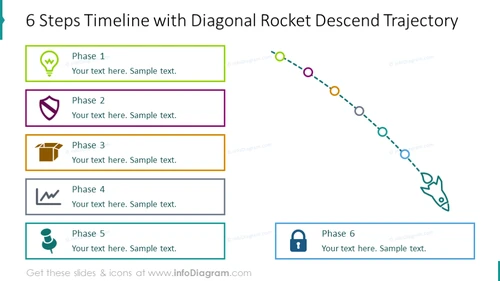
Six steps timeline shown with diagonal rocket descend trajectory
from deck
Rocket Launch Diagram (PPT Template)
- Info
- How To Edit
- Usage example
Info
6 Steps Timeline with Diagonal Rocket Descend Trajectory
Slide Content
The slide illustrates a 6-step timeline with a theme of a diagonal rocket descending trajectory. Each phase is accompanied by an icon and a colored border. "Phase 1" includes a lightbulb icon signifying an idea or inception. "Phase 2" features a shield icon, perhaps indicating a protection or security stage. "Phase 3" has a box icon that could represent packaging or product development. "Phase 4" shows a waveform or pulse icon, suggesting analysis or monitoring. "Phase 5" uses a person icon, which might imply a human resource or team-focused step. Finally, "Phase 6" is marked with a lock icon, symbolizing completion or the locking in of the results.
Graphical Look
- The slide's background is white.
- Title of the slide is bold and aligned to the top in blue font.
- Six rectangular shapes are aligned horizontally, each with a different color outline and an icon inside.
- The icons are diverse, including a lightbulb, shield, box, waveform, person, and lock.
- A dotted line with circles of various colors trails from left to right, descending diagonally across the slide with a rocket icon at the end.
- Each circle on the dotted line corresponds to the color of the outline of each phase's rectangle.
- Text placeholders with "Your text here. Sample text." are provided adjacent to each rectangle.
The overall look of the slide is clear and structured, using simple iconography to represent different phases. The diagonal rocket trajectory suggests motion and progression through the steps.
Use Cases
- Presenting a project timeline or development roadmap in business meetings.
- Describing the stages of a product lifecycle from ideation to completion.
- Explaining sequential steps in a process improvement or strategic plan presentation.
- Illustrating a decrease in metrics, costs, or other variables over time in performance reports. I'm sorry, but there seems to have been an error in processing your request. There is no attached image for me to describe. If you'd like to try again and attach an image, I'd be happy to help you with your request.
How To Edit
How to edit text & colors

How to expand / shorten diagram

How to Replace Icons in infoDiagram PPT


