Financial Decks
Visualize your results with ease
Product Sales Charts
from deck
Product Sales Report Charts (PPT Template)
Info
Product Sales Charts Template
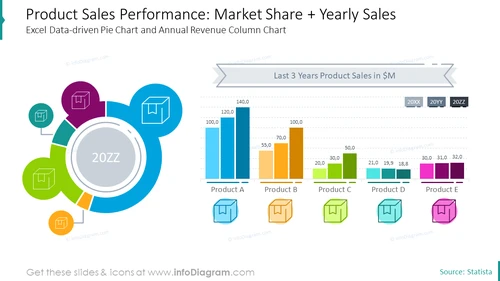
This is an editable PowerPoint template illustrating product sales performance. Use the pie chart with meaningful graphics or the bar chart compilation to showcase the number of sales during the past years. You can also compare products against each other according to the market share and yearly sales metrics.
What Does This Product Sales Charts Template Include?
- editable colorful Excel-driven pie chart with illustration for annual revenue
- editable Excel-driven bar charts with illustrations for yearly revenues of multiple products
- light grey ribbon-shaped title container
- an outline icon of a product
This Product Sales Charts Template is a part of our Product Sales Report Charts PPT Template.


