Financial Decks
Visualize your results with ease
Products Sales Turnover Comparison Template
4 items charts with description placeholder
from deck
Product Sales Report Charts (PPT Template)
Info
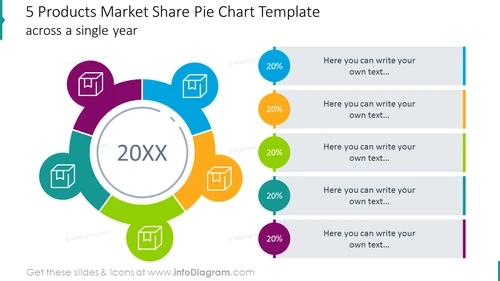
Products Sales Turnover Comparison Template Slide (4 items charts with description placeholder)
Use this bold PowerPoint pie chart diagram to discuss the market share of 5 products across a single year. List all items on the side, express their percentage amount and add your description. Keep given graphics and colors or adjust them to our company's branding easily.
What Does This Products Sales Turnover Comparison Template Slide (4 items charts with description placeholder) Include?
- editable colorful pie chart with icons in circular shapes
- a pile of light grey text containers with percentage numbers and matching colors for products descriptions
- an outline icon of a product
This Products Sales Turnover Comparison Template Slide (4 items charts with description placeholder) is a part of our Product Sales Report Charts PPT Template.


