Financial Decks
Visualize your results with ease
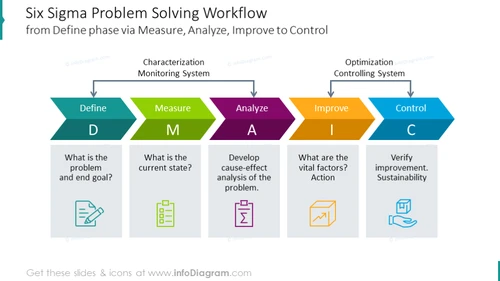
Problem-solving workflow shown with a scheme and outline icons
from deck
Six Sigma Presentation DMAIC Diagrams (PPT template)
Info
Problem-solving Workflow Shown With a Scheme and Outline Icons Template
PowerPoint Six Sigma problem-solving flowchart illustrating the process from defining through measuring, analyzing, improving, to control. Explain the DMAIC method giving examples of each step of the process and describing phases of monitoring and controlling the system. Learn about DMAIC and six sigma on Wikipedia.
What Does This Problem-solving Workflow Shown With a Scheme and Outline Icons Template Include?
- 5 colorful arrow-shaped elements with titles representing steps of the DMAIC process
- 5 editable text containers with icons for your descriptions
- arrows pointing in both directions marking the start and end of the monitoring and controlling systems
- outline icons of design, document, definition, checklist, flipchart, summary, product, improvement, offering product
This Problem-solving Workflow Shown With a Scheme and Outline Icons Template is a part of our Six Sigma Presentation DMAIC Diagrams PPT Template.


