Financial Decks
Visualize your results with ease
Yearly Business Review Presentation Template (PPT icons and tables)
from deck
Yearly Business Review Presentation Template (PPT icons and tables)
Info
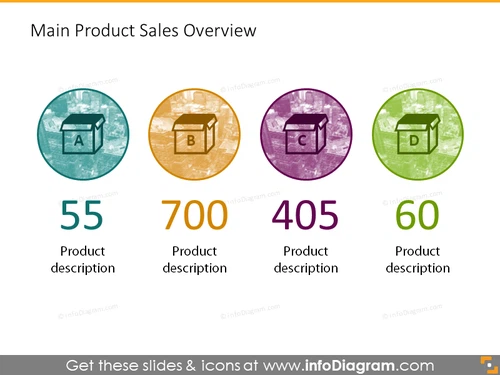
Main Product Sales Overview
Slide Content
The slide titled "Main Product Sales Overview" provides a concise summary of sales figures for four main products labeled A, B, C, and D. These products have corresponding sales quantities presented as large numerical figures: 55, 700, 405, and 60, underneath which, each has a placeholder for a brief product description, suggesting a snapshot of performance or significance of the products. The differentiation in colors and icons hints at distinct product categories or characteristics.
Graphical Look
- Four circular icons with a letter inside each (A, B, C, D), representing different products.
- The icons are colored differently (blue, orange, purple, green) to differentiate between the products.
- A large numeral below each icon showing the sales number associated with that product (55, 700, 405, 60).
- Below each sales figure, there is a text placeholder that reads "Product description".
- All graphical elements are evenly spaced and aligned horizontally across the slide.
- Each icon is encased in a thin circle outline, adding a touch of visual cohesion.
The slide exhibits a clean and modern design with a focus on clarity and readability. The use of color-coding and stylish icons makes it visually engaging and helps convey the data at a glance.
Use Cases
- Presenting sales data during a quarterly business review to show performance metrics for different products.
- Summarizing key product performance in a marketing or sales strategy meeting.
- Using it in investor presentations to highlight successful products or sales trends.
- Displaying the slide during internal team meetings to set targets or discuss product focus areas.


