Financial Decks
Visualize your results with ease
3 stages cycle diagram
from deck
Modern Flat Diagrams - Ultimate Bundle for Visual Presentations (PPT graphics)
Info
3 Stages Cycle Diagram
Slide Content
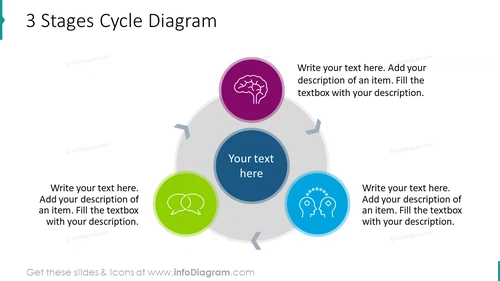
The slide presents a "3 Stages Cycle Diagram" which could typically be used to describe a process that has three interconnected stages. Each stage is represented by a circular node, with directional arrows indicating the flow from one stage to the next, forming a cyclical pattern. The nodes are for users to fill with their text and description; they are anchored by icons—a brain, speech bubbles, and two heads with gears—suggesting thematic concepts like thinking, communication, and collaboration or teamwork respectively.
Graphical Look
- A large gray cycle with directional arrows pointing clockwise connects three colored circles.
- Each circle contains an icon: the first is purple with a brain, the second green with speech bubbles, and the third light blue with two heads and gears.
- The central circle, larger than the others and colored blue, serves as the primary area for inputting text.
- Placeholder text prompts users to add their own descriptions corresponding to each stage of the cycle.
- The design is clean and modern, using flat icons and bright contrasting colors to distinguish each stage.
The overall look of the slide is sleek and contemporary, with a professional appearance suitable for business presentations. The use of color and icons makes the slide visually appealing and helps to convey the cyclic nature of the process being described.
Use Cases
- Explaining a three-step process in project management during team meetings or training sessions.
- Showcasing a product development life cycle in a business pitch or investor update.
- Illustrating communication flow within an organization in an HR presentation.
- Presenting a marketing strategy framework that involves three key phases to stakeholders.


