Financial Decks
Visualize your results with ease
Stripe column design table with hand-drawn marker
from deck
Modern Flat Diagrams - Ultimate Bundle for Visual Presentations (PPT graphics)
Info
Stripe Column Design Table with Hand-drawn Marker
Slide Content
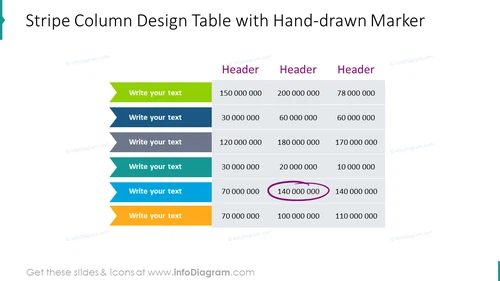
The slide appears to be a template for presenting data in a table format with an emphasis on comparison across different categories or time periods. Each row is associated with a "Write your text" placeholder, suggesting that the user can input their own descriptions or titles for each row. Each column is headed by "Header," which can be customized to represent different data sets or categories for comparison. The table includes numerical data, with some numbers circled by a hand-drawn marker to highlight them, signifying their importance or deviation.
Graphical Look
- The slide features a title in large bold text at the top.
- There are seven rows with alternating color backgrounds – green, blue, green, blue, green, blue, and orange at the bottom.
- Each row has a 'Write your text' placeholder on the left side for inserting text.
- Four-column headers are presented at the top of the table in dark text.
- Numerical values are aligned in each column under the headers.
- One of the numerical values is circled with a hand-drawn marker indicating significance.
- The design is clean and uses flat colors with no gradients.
The overall look of the slide is modern and minimalistic, with a clear emphasis on readability and contrast between elements to allow for easy comparison of data.
Use Cases
- Presenting financial results or budget allocations across different departments or projects.
- Comparing sales figures for multiple products or services within a given period.
- Showing statistical data or performance metrics in business or academic presentations.
- Highlighting key data points or anomalies in large datasets during a strategic analysis session.


