Financial Decks
Visualize your results with ease
Traction line chart template with commentary fields
from deck
Line Chart Data-driven Graphics (PPT Template)
Info
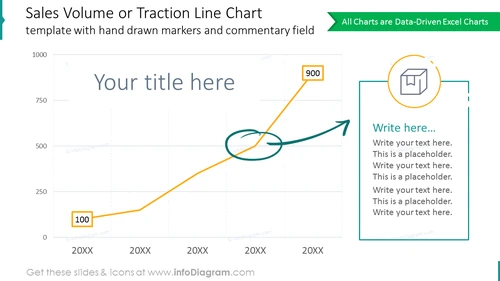
Traction Line Chart Template With Commentary Fields Diagram
This is a traction line chart presenting the sales volume over the years. Mark the initial and outcome numbers clearly and highlight any critical point on the line with editable scribbled graphic elements: an oval and an arrow. Add your comment in the outline illustrated text container on the side.
What Does This Traction Line Chart Template With Commentary Fields Diagram Include?
- Editable Excel data-driven line chart with marked initial and outcome numbers
- Scribbled graphic elements for highlighting data on the line chart: an oval and an arrow
- Outline text container with an outline icon of a box for your description
This Traction Line Chart Template With Commentary Fields Diagram is a part of our Line Chart Data-driven Graphics PPT Template.


