Financial Decks
Visualize your results with ease
Traits comparison DNA Helix graphics
from deck
Modern Flat Diagrams - Ultimate Bundle for Visual Presentations (PPT graphics)
Info
Traits Comparison DNA Helix Graphics Template
Slide Content
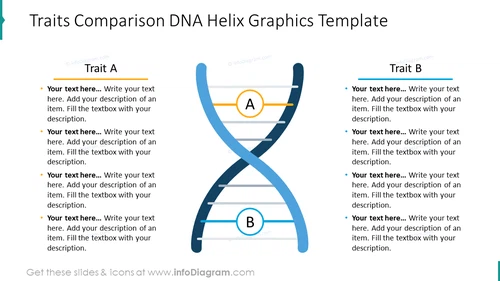
The slide is titled "Traits Comparison DNA Helix Graphics Template." It is designed to help compare two different traits, labeled "Trait A" on the left and "Trait B" on the right. The slide features a stylized representation of a DNA double helix with two main segments labeled A and B. Each trait has five points for comparison, where the audience can add descriptions for each trait facilitates a clear and visual comparison between two sets of attributes or characteristics.
Graphical Look
- Central graphic of a stylized DNA double helix in blue color, with a twisted ladder-like structure symbolizing the intertwining strands.
- Two circles labeled 'A' and 'B' located at the intersection points of the helix.
- Five horizontal lines connect the two strands of the DNA helix on either side, providing spaces for text corresponding to "Trait A" and "Trait B."
- Orange horizontal bars above the lists of comparison points for Trait A and Trait B serve as headings.
- Blue bullet points preceding each placeholder text item, which are intended for the user to replace with their own content.
- The background is white, providing high contrast for the text and graphics.
The slide has a clean and modern appearance with a creative conceptual graphic that immediately suggests comparison and linkage. The color palette is limited to blue, black, gray, and orange, keeping the focus on the content and structure.
Use Cases
- To compare different characteristics of two competing products or services in a business presentation.
- In an educational setting, to illustrate the comparison of features or attributes studied in genetics or biology.
- To demonstrate contrasting strategies or approaches within a company or team meeting.
- For visualizing the comparison of theoretical concepts or frameworks during conferences or workshops.


