Financial Decks
Visualize your results with ease
Trend radar template for market analysis
from deck
Business Trend Radar Charts for Market Analysis (PPT Template)
Info
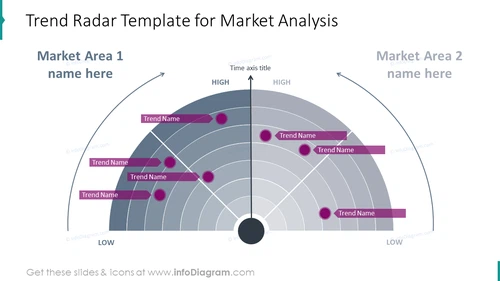
Trend Radar Template for Market Analysis
Slide Content:
This slide is a Trend Radar Template used for Market Analysis, dividing the radar into Market Area 1 and Market Area 2 for comparison. Each market area is assessed with trends plotted on a scale from "LOW" to "HIGH" over time, represented on the central vertical axis. The trends are marked with circular icons and connected with lines to their descriptions, indicating their position and importance in the market over time, which helps in identifying emerging trends and areas of growth or concern.
Graphical Look:
- A large central vertical axis labeled "Time axis title" with arrows pointing to "HIGH" at the top.
- Semi-circular sections on either side of the axis, shaded in gradients of grey for Market Area 1 and 2.
- Concentric circles create a radar effect, with the outermost circle labeled "LOW" and the innermost "HIGH".
- Rectangular text boxes with "Trend Name" labels, connected to corresponding circular icons by lines.
- Bold, capitalized text for "Market Area 1" and "Market Area 2" names on either side of the radar.
The slide is designed with a clean, professional look, using gradients and contrast to emphasize the analysis of market trends. It is structured to present data in an easily understandable radar format.
Use Cases:
This slide is suitable for business presentations that focus on market research, competitive analysis, strategic planning, and product development meetings. It helps stakeholders understand the positioning of various market trends and informs decision-making regarding resource allocation and strategy.


