infoDiagram
>
Creative Styles
>
Outline Design
>
Outline Diagrams - Ultimate Deck for Visual Presentations (PPT graphics)
>
Venn diagram with three overlapping circles
Venn diagram with three overlapping circles
from deck
Outline Diagrams - Ultimate Deck for Visual Presentations (PPT graphics)
- Info
- How To Edit
- Usage example
Info
Venn Diagram - 3 Overlapping Circles Intersection Areas
Slide Content
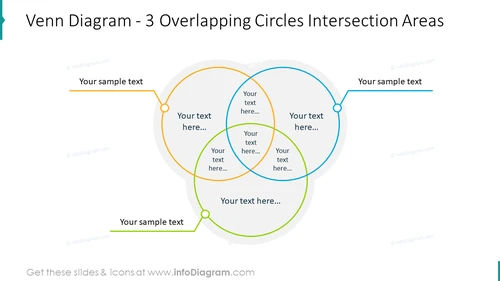
The slide presents a Venn diagram with three overlapping circles, each in a different color. It visually represents the intersections and relationships between three distinct groups or concepts. There are editable text boxes for each circle and the overlapping areas, allowing presenters to depict shared attributes or elements. The central intersection, where all three circles overlap, has its own text box to highlight the commonality among all three concepts.
Graphical Look
- The slide background is white, creating a clean and minimalistic appearance.
- Three translucent circles with soft edges are overlapping in the layout: one orange, one blue, and one green, representing the Venn diagram's intersection areas.
- Each circle has a circular node with a slightly darker shade at the top where text labels can be inserted.
- The intersections of the circles create distinct areas for additional text, indicating areas of shared properties or relationships of the sets.
- Horizontal text boxes with sample text are present on both the left and right sides of the slide, aligned with the outer circles.
- A horizontal text box below the diagram allows for further descriptions or conclusions.
- The circles and text boxes are connected with thin, colored lines that match the circles' colors.
The overall look is professional and business-like with a balance in visual elements that aids in focusing on the content. The strategic use of color assists in distinguishing different sections of the diagram effectively.
Use Cases
- To analyze relationships and commonalities between different business units or departments.
- In marketing presentations to compare target audiences, market segments, or consumer behaviors.
- During strategic planning sessions to identify overlapping competencies, resources, or strategic priorities.
- For educational purposes to explain complex concepts and their intersections in a visual manner.
How To Edit
How to edit text & colors

How to expand / shorten diagram

How to Replace Icons in infoDiagram PPT


