Financial Decks
Visualize your results with ease
Yearly events plan timeline
from deck
Modern Flat Diagrams - Ultimate Bundle for Visual Presentations (PPT graphics)
Info
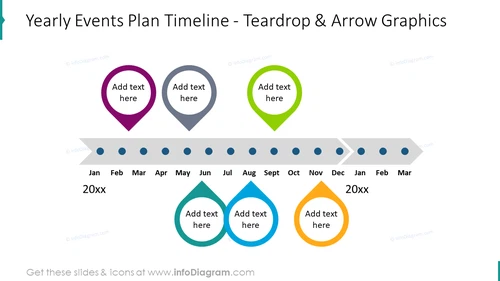
Yearly Events Plan Timeline - Teardrop & Arrow Graphics
Slide Content
This PowerPoint slide is designed to display a timeline for a yearly events plan using teardrop and arrow graphics. There are markers for each month from January to March of the following year, with specific teardrop markers for June, July, and December, indicating these months have events. Users can add detailed text within the teardrop shapes. These teardrop markers point to specific months, demonstrating the chronological sequence of events, and help the audience focus on these key points in the plan.
Graphical Look
- The slide background is white, providing a neutral canvas for the content.
- The slide title is at the top, using bold, dark text for emphasis.
- Three colored teardrop shapes (purple, grey, and green) are at the top, each with a "Add text here" prompt in white font.
- A horizontal arrow-timeline is just below, with a light blue gradient and labeled months from January to March of the next year.
- Below the timeline are three additional teardrop markers in blue, teal, and orange, each overlapping a specific month and containing "Add text here" text.
- Small, circular markers are along the timeline to denote the months, with those corresponding to the teardrop markers being more prominent.
The visual design of the slide is clean and modern, relying on the use of shapes and contrasting colors to differentiate points in the timeline. The shapes are easily identifiable and the layout facilitates a quick understanding of a yearly plan sequence.
Use Cases
- Presenting annual company milestones or project deliverables
- Outlining marketing and event strategies for the year
- Showcasing organization-specific key dates like product launches or service updates
- Planning and displaying academic or curriculum timelines for educational institutions


