Financial Decks
Visualize your results with ease
yearly timeline template with rounded callouts for 4 elements
from deck
Timeline Diagram Infographics (flat PPT template)
Info
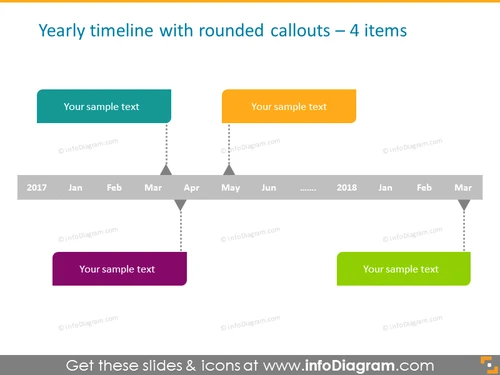
Yearly timeline with rounded callouts – 4 items
Slide Content
The slide is a visualization of a yearly timeline, indicating four key events or milestones represented by rounded callout boxes in different colors. Each callout is connected to a specific month on the timeline, suggesting a linear progression of events or tasks throughout the year. This format can be used to summarize annual plans, project phases, business quarters, or significant achievements.
Graphical Look
- A horizontal timeline occupying the lower third of the slide, spanning two years (2017 and 2018), with abbreviated months indicated below each year.
- Four rounded rectangular callout boxes, each associated with a different time on the timeline, via a dotted line leading to the corresponding month. The callouts are in distinct colors: teal, orange, purple, and green.
- Placeholder text "Your sample text" within each callout box, indicating where custom text can be added.
- Each callout box is connected to the timeline with a dotted gray line, which suggests a correspondence between the callout and a specific point in time on the timeline.
The slide has a clean and professional appearance, using a limited color palette for clarity. The rounded callout boxes add a modern touch to the classical timeline layout.
Use Cases
- Presenting an annual company report with highlights of key achievements and milestones.
- Illustrating project timelines in project management presentations, indicating phases or deliverable dates.
- Summarizing the release schedule of products or services in a business plan presentation.
- Outlining historical timelines or future plans in educational or training settings.


