Financial Decks
Visualize your results with ease
Yearly timelines projects summary
from deck
Status Review Meeting Template (PPT graphics)
Info
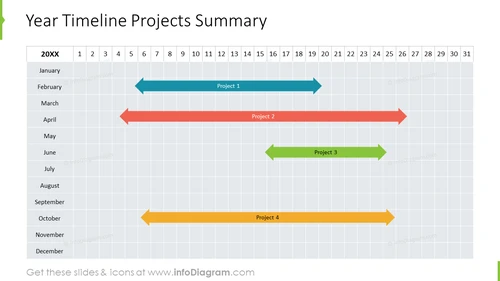
Year Timeline Projects Summary
Slide Content
The slide presents a timeline for four different projects over a 12-month period. Each project is represented by a horizontal arrow with different colors and spans various lengths, denoting the project duration. "Project 1" starts in January and ends in March, depicted by a light blue arrow. "Project 2" spans from February to April, indicated by a rose-colored arrow. "Project 3" is shown by a green arrow, starting in March and concluding in April. Lastly, "Project 4" is an amber arrow running from October to December.
Graphical Look
- The slide's background is a grid representing a timeline, with columns for months and rows for days.
- Horizontal arrows with different colors (light blue, rose, green, and amber) represent the duration of projects.
- The months (January to December) are listed on the left side, whereas the days (labeled 1 - 31) are at the top.
- Each project has a label (Project 1, Project 2, etc.) centered on its corresponding arrow.
- The slide title "Year Timeline Projects Summary" is in a large bold font at the top of the slide.
The slide design is minimalistic and uses a muted color palette. The use of arrows aids in clearly conveying the duration and sequence of the projects.
Use Cases
- Visualizing project timelines during a project planning meeting to assess resource allocation.
- Presenting an annual overview of project schedules in a stakeholder or client briefing.
- Monitoring progress in a project portfolio management review to ensure adherence to timelines.
- Facilitating discussions on workflow and potential overlaps in projects during a team meeting.


