Financial Decks
Visualize your results with ease
Annual Revenue Key Growth Drivers
from deck
Listed Company Financial Report Presentation (PPT Template)
Info
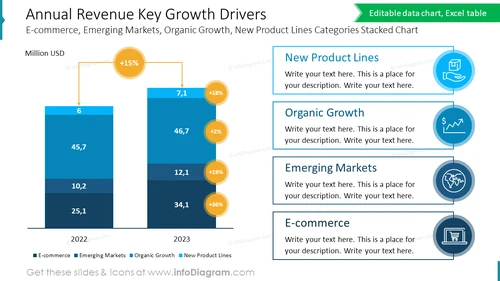
Annual Revenue Key Growth Drivers
This slide is an analytical PowerPoint tool designed to display the key growth drivers of a company's annual revenue. It uses a stacked bar chart and percentage increase markers to illustrate the contributions of different sectors like e-commerce, emerging markets, and new product lines to the company's financial growth. Ideal for strategic business reviews or investor presentations, this infographic template succinctly visualizes complex data for clear communication.
What Does This Annual Revenue Key Growth Drivers Include?
- A stacked Excel-driven bar chart comparing two years with color-coded categories
- Percentage increase in callouts between the two years for each category
- Circular shapes with icons representing different growth factors, aligned vertically: offer, product, increase, line chart, globe, world, online shop
- Editable text boxes for detailed descriptions next to each icon
- A legend at the bottom explaining the color coding of the chart


