Financial Decks
Visualize your results with ease
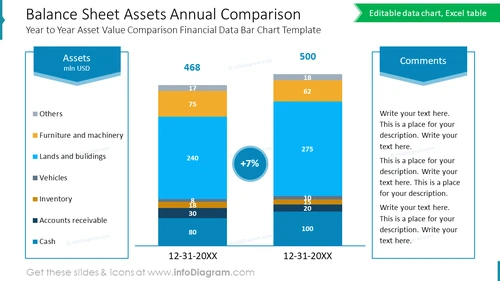
Balance Sheet Assets Annual Comparison
from deck
Listed Company Financial Report Presentation (PPT Template)
Info
Balance Sheet Assets Annual Comparison
This PowerPoint slide is a visual template tailored for financial reporting, specifically to compare a company's balance sheet assets on an annual basis. It utilizes bar charts to represent year-to-year asset values, facilitating a clear comparison and trend analysis in business presentations such as annual meetings, investor briefings, and strategic financial planning sessions.
What Does This Balance Sheet Assets Annual Comparison Include?
- Two Excel-driven bar charts, one for each year, showing values of different asset categories
- A central percentage change indicator between the two charts
- Color coding for various asset types, such as cash, inventory, and receivables
- Text boxes for additional comments or notes
- A title banner at the top and a header for each bar chart


