Financial Decks
Visualize your results with ease
Balance Sheet Equity and Liabilities
from deck
Listed Company Financial Report Presentation (PPT Template)
Info
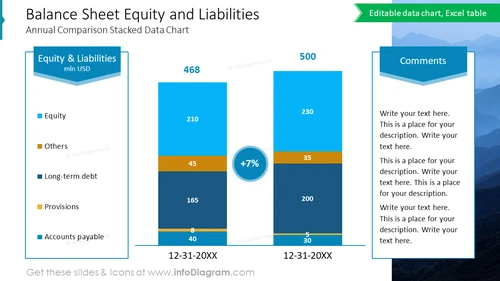
Balance Sheet Equity and Liabilities
This PowerPoint slide provides a visual template to compare the equity and liabilities of a company across two different periods. It's an essential tool used in financial reporting presentations to illustrate changes in a company's financial structure, particularly useful for accountants, financial analysts, and business executives during annual general meetings or internal audits.
What Does This Balance Sheet Equity and Liabilities Include?
- Two Excel-driven stacked bar charts, each representing a fiscal year, with segments for various liabilities and equity
- A percentage change indicator between the two charts
- Legends corresponding to each segment of the bar chart for clarity
- A comment box on the right for additional annotations
- The slide's title in bold at the top, with a subtitle providing context


