Financial Decks
Visualize your results with ease
Billing Value Development and CAGR per Region
from deck
Corporate Business Plan Presentation with ESG Strategy (PPT Template)
Info
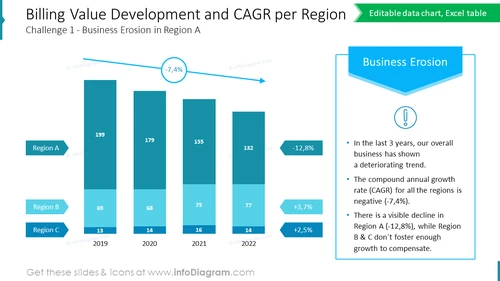
Billing Value Development and CAGR per Region
This slide is a graphical representation of financial performance across different regions, crucial for business presentations analyzing regional sales trends and growth rates. It serves as an infographic within a PowerPoint PPT, visualizing data through a bar chart that makes complex information easily understandable, ensuring the template aids in strategic decision-making discussions.
What Does This Billing Value Development and CAGR per Region Include?
- A bar chart displaying numeric data for three regions across four years
- Annotations indicating the percentage change in billing value year-over-year
- A right-side panel titled "Business Erosion" with bullet points summarizing the data trend
- Color-coded arrows and callouts emphasizing specific data points


