Financial Decks
Visualize your results with ease
Business Performance Metrics
from deck
Annual Report Company Performance Presentation (PPT Template)
Info
Business Performance Metrics Layout
Slide Content:
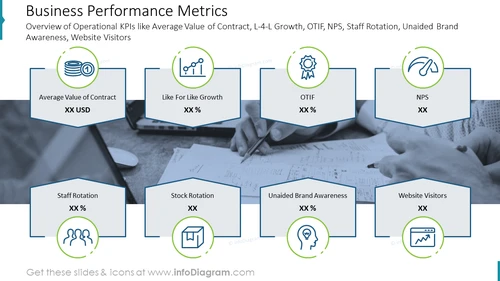
This slide is a comprehensive overview of various operational Key Performance Indicators (KPIs) for a business. Business performance metrics mentioned on the slide:
-
Average Value of Contract: This metric indicates the average revenue a company can expect from contracts over a given period. It's a crucial indicator of the company's ability to attract lucrative deals and the overall value clients bring to the business.
-
Like For Like Growth (L4L Growth): Often used in retail, this measures the growth in sales or revenue, comparing the same period in different years, for the same set of stores or products, to indicate organic growth excluding new openings.
-
On-Time In-Full (OTIF): This KPI measures the delivery performance of a company by tracking the percentage of orders delivered on time and in the complete quantity requested. It's a vital metric for supply chain efficiency and customer satisfaction.
-
Net Promoter Score (NPS): This is a measure of customer loyalty and satisfaction. It's derived from asking customers how likely they are to recommend the company to others on a scale, typically from -100 to 100.
-
Staff Rotation: Also known as employee turnover rate, this metric measures how often employees leave and are replaced within a company. High turnover can indicate dissatisfaction or problems within the workplace culture or compensation structures.
-
Stock Rotation: This measures how often a company's inventory is sold and replaced over a period. It's a critical metric for understanding inventory management efficiency and can impact cash flow and storage costs.
-
Unaided Brand Awareness: This refers to the percentage of people who can recall a company's brand without any help or prompts. It's a direct measure of brand strength and marketing effectiveness.
-
Website Visitors: The number of unique visitors that come to a company's website, indicating the company's online presence's reach and the effectiveness of its digital marketing strategies.
Each of these metrics provides insights into different aspects of a company's performance, from sales and marketing effectiveness to operational efficiency and customer satisfaction. They are typically tracked over time to understand trends and inform strategic decisions.
Graphical Look:
- The slide has a clean, professional design with a monochromatic color scheme.
- Each KPI is represented by a distinct icon encircled in green, suggesting a focus on specific areas of business performance.
- Icons include a stack of coins, a growth chart, a gear for operations, and a thumbs-up for NPS, among others.
- The background features a subtle image of a person writing, which adds to the business context.
The slide is visually balanced with clear demarcations for each KPI, and the use of icons provides an intuitive understanding of each metric.
Use Cases:
This slide is ideal for use in business strategy meetings, performance review presentations, investor updates, and team briefings to communicate the company's operational health and performance effectively.


