Financial Decks
Visualize your results with ease
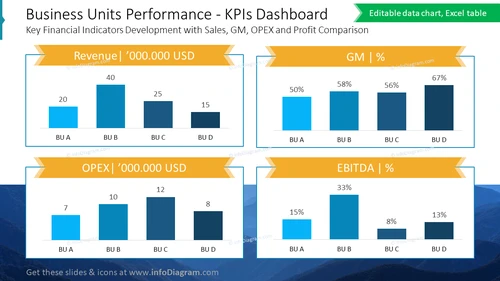
Business Units Performance - KPIs Dashboard
from deck
Listed Company Financial Report Presentation (PPT Template)
Info
Business Units Performance - KPIs Dashboard
This PowerPoint slide is a detailed dashboard designed to present a comprehensive view of a company's business units' performance using key financial indicators. It displays metrics such as sales, gross margin (GM), operating expenses (OPEX), and EBITDA in an easily interpretable format, suitable for corporate financial reviews and strategy meetings to assess and compare the performance of different segments within the organization.
What Does This Business Units Performance - KPIs Dashboard Include?
- Excel-driven bar charts representing revenue and OPEX in USD for different business units (BUs)
- Additional bar charts showing percentages for GM and EBITDA for each BU
- A color palette of blue and orange for visual differentiation of the data points


