Financial Decks
Visualize your results with ease
Capital Market Ratios
from deck
Listed Company Financial Report Presentation (PPT Template)
Info
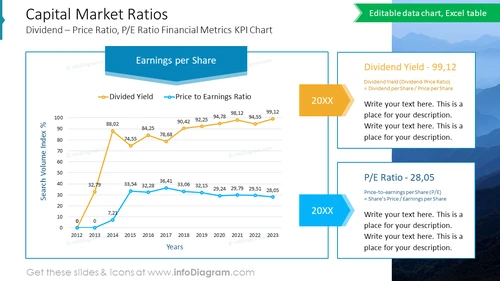
Capital Market Ratios
This PowerPoint slide showcases a line graph tracking key financial metrics: Dividend-Price Ratio and P/E Ratio across multiple years, providing insights into market valuation and shareholder returns. The slide is vital for investors and financial analysts, serving as a clear infographic for comparative market assessment and trend analysis.
What Does This Capital Market Ratios Include?
- A dual-axis editable Excel-driven line graph with separate scales
- Data series for Dividend Yield and P/E Ratio
- Year markers from 2012 to 2023
- A defined color scheme for each data series
- A comments section for additional annotations


