Financial Decks
Visualize your results with ease
Cash Flow Margin Development
from deck
Listed Company Financial Report Presentation (PPT Template)
Info
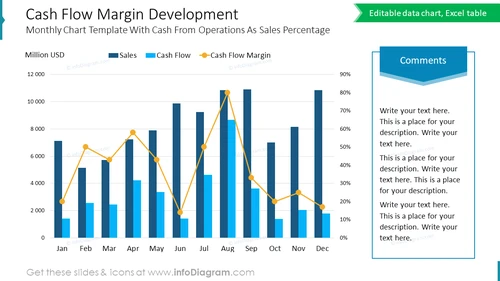
Cash Flow Margin Development
This PowerPoint slide is an illustrative template that visualizes the cash flow margin development of a company. Displayed in a monthly chart format, it correlates cash from operations to sales, depicting the efficiency of revenue conversion into cash. It's particularly useful in financial presentations aimed at analyzing cash flow trends and operational effectiveness over a year.
What Does This Cash Flow Margin Development Include?
- A combination editable Excel-driven bar and line chart displaying sales, cash flow, and cash flow margin for each month
- A dual-axis system with sales and cash flow in bars and margin as a line with data points
- A comments box on the right side for annotations
- Color distinctions for different financial metrics
- A clear, concise title and subtitle that denote the content of the slide


