Financial Decks
Visualize your results with ease
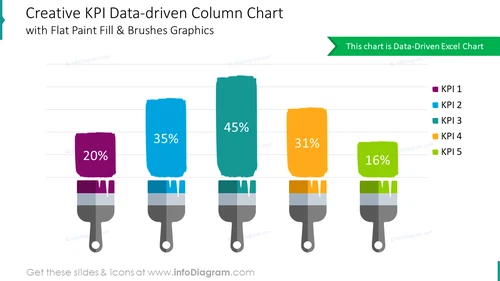
Creative KPI Data-driven Column Chart Slide
from deck
Flat Paint Brush Strokes Diagrams (PPT Template)
Info
Creative KPI Data-driven Column Chart Slide slide content
The Creative KPI Data-driven Column Chart Slide can be used when you want to present your company's KPIs visually compellingly and easily understandable. For example, you can use this PPT slide in a performance review presentation to showcase important metrics and highlight areas of success or improvement. You can also use it in product development presentations to showcase performance metrics such as user engagement, product usage, and customer feedback. The chart is divided into different segments, each representing a specific KPI, and color-coded for easy reference. This is a Data-Driven Excel Chart. You can download this PPT template on Google Slides and Keynote.
Creative KPI Data-driven Column Chart Slide slide infographics
White Background, Colorful Paint Fill & Brushes Graphics


