Financial Decks
Visualize your results with ease
Efficiency Ratios
from deck
Listed Company Financial Report Presentation (PPT Template)
Info
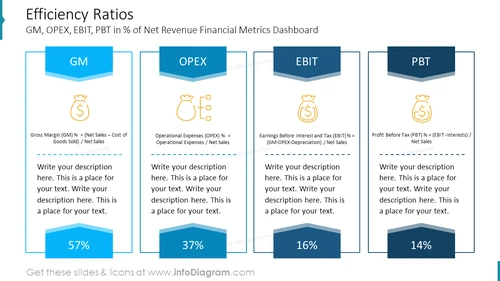
Efficiency Ratios
This Slide Showcases A Dashboard With Financial Metrics, Specifically Efficiency Ratios Like GM, OPEX, EBIT, And PBT, Expressed As Percentages Of Net Revenue. Ideal For Financial Presentations In PowerPoint To Illustrate Key Performance Indicators.
What Does This Efficiency Ratios Include?
- Four distinct blocks labeled GM, OPEX, EBIT, PBT
- Each block contains an icon representing the financial metrics
- Percentages are prominently displayed in each block
- Descriptive formulas for each metric are provided
- A cohesive blue color scheme unites the blocks
- Ample space for custom descriptions below each metric


