Your graphics add a nice touch to my presentations and I recently used them for one of my all-hands meetings. Your toolbox adds professionalism to my slides. Instead of using standard clipart.
Claude Jones, Director of Engineer, @Walmartlabs, USA
Your graphics add a nice touch to my presentations and I recently used them for one of my all-hands meetings. Your toolbox adds professionalism to my slides. Instead of using standard clipart.
Claude Jones, Director of Engineer, @Walmartlabs, USA
I needed a fresh look at some of my slides. I've tried to find a way to create a paintbrush effect, to underline, accentuate, add some color and the handwritten markers were just the things. Very easy to use, easy to size, change the color. It was an affordable, perfect solution and I'm happy to recommend it.
Anonymous, US
The crisp, clean look of the graphics, and the fact that it allowed me to easily edit and change the colors to match the template was my main reason for purchasing them.
Brandie Jenkins, E-learning Developer, USA
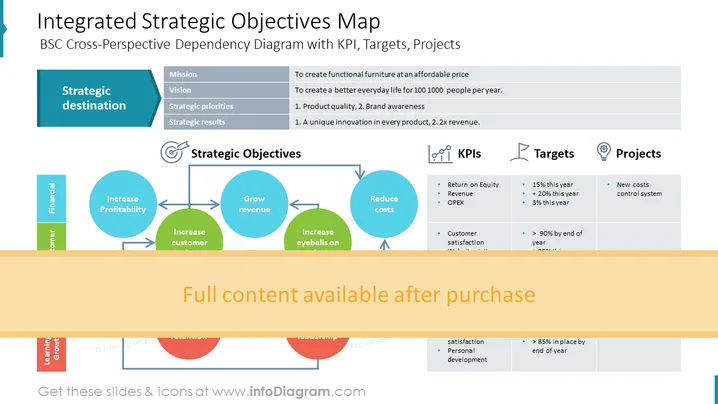
The slide presents a Balanced Scorecard (BSC) Cross-Perspective Dependency Diagram with Key Performance Indicators (KPIs), Targets, and Projects. There are five main elements described: Strategic destination which lists "Mission," "Vision," "Strategic priorities," and "Strategic results"; Strategic Objectives including "Increase Profitability," "Grow revenue," "Reduce costs," and "Increase eyeballs on"; KPIs like "Return on Equity," "Revenue," "OPEX," and "Customer satisfaction"; Targets such as "+15% this year," "+20% this year," and "> 90% by end of year"; and Projects mentioning "New costs control system."
The slide has a balanced and clean look with a professional color scheme that clearly illustrates the connections between corporate strategy elements.


