Financial Decks
Visualize your results with ease
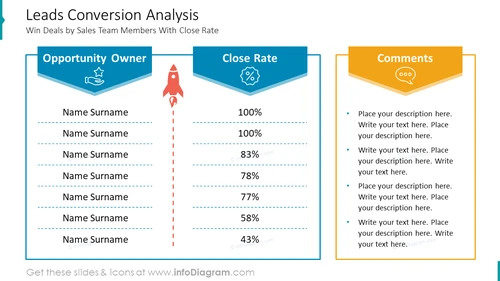
Leads Conversion Analysis
from deck
Company Town Hall Meeting Presentation (PPT Template)
Info
Leads Conversion Analysis Slide
Slide Content:
- Opportunity Owner: The person responsible for closing the lead.
- Close Rate: The percentage of leads that are converted into customers.
- Comments: Additional information about the lead or the opportunity, such as the stage of the sales process or the reason for losing the deal.
Graphical Look:
- The slide has a simple, professional design.
- The table is formatted with alternating light and dark gray rows, and the table header is in blue.
- The table is sorted by Close Rate, with the highest Close Rate at the top.
- There is a small chart at the bottom of the slide that shows the distribution of Close Rates for the four sales team members.
The slide is well-organized and easy to read. The table is formatted in a way that makes it easy to compare the Close Rates of the different sales team members. The chart at the bottom of the slide provides a visual representation of the distribution of Close Rates.
Use Cases
This slide can be used in a variety of business presentations, including:
- Sales team presentations: To track the performance of individual sales team members and identify areas where improvement is needed.
- Sales management presentations: To track the performance of the sales team as a whole and to identify trends and patterns.
- Marketing presentations: To track the performance of marketing campaigns and to identify which campaigns are most effective at generating leads.
- Executive presentations: To provide a high-level overview of the sales pipeline and to identify any potential risks or opportunities.


