Financial Decks
Visualize your results with ease
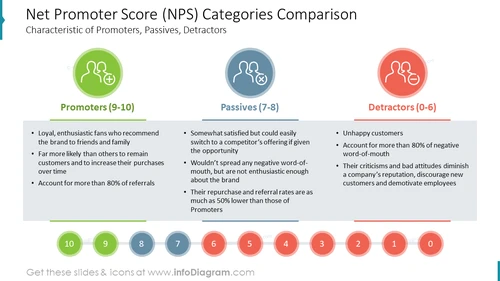
Net Promoter Score (NPS) Categories ComparisonCharacteristic of Promoters, Passives, Detractors
from deck
Customer Experience Metrics Diagrams (PPT Template)
Info
Net Promoter Score (NPS) Categories Comparison Chart
This PowerPoint slide provides a comprehensive overview of the Net Promoter Score (NPS) system, a widely used customer loyalty metric. It delves into the characteristics of the three customer categories – Promoters, Passives, and Detractors – and highlights their impact on business growth and customer retention. This infographic-style slide can be effectively incorporated into presentations related to customer satisfaction, marketing strategies, and business performance.
What Does This Net Promoter Score (NPS) Categories Comparison Chart Include?
- A horizontal layout with three distinct sections representing the three NPS categories – Promoters, Passives, and Detractors
- Clear demarcation of each category section using contrasting colors – green for Promoters, blue for Passives, and red for Detractors
- Bulleted points outlining the key characteristics of each customer category
- A numerical scale ranging from 0 to 10 at the bottom, representing the NPS rating system
- Outline icons of people, customers, clients, promoters, passives, and detractors


