Financial Decks
Visualize your results with ease
Performance Dashboard of Listed Company
from deck
Listed Company Financial Report Presentation (PPT Template)
Info
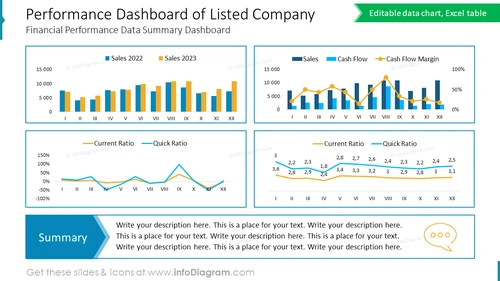
Performance Dashboard of Listed Company
This PowerPoint slide offers a comprehensive overview of a listed company's financial performance. It visualizes sales data comparison, cash flow trends, and liquidity ratios, essential for assessing a firm's financial status. The slide functions as an executive summary, allowing for an at-a-glance analysis of sales performance over two years, cash flow efficiency, and financial stability via current and quick ratios.
What Does This Performance Dashboard of Listed Company Include?
- An editable Excel-driven bar chart comparing monthly sales for 2022 and 2023
- A combination chart plotting monthly cash flow against cash flow margin percentage
- Line graphs displaying the trends of current and quick ratios month-by-month
- Text box for additional comments and analyses
- Numeric markers for precise data points
- Color coding for different years and financial metrics for easy differentiation


