Financial Decks
Visualize your results with ease
Revenue and Profit Snapshot Dashboard
from deck
Listed Company Financial Report Presentation (PPT Template)
Info
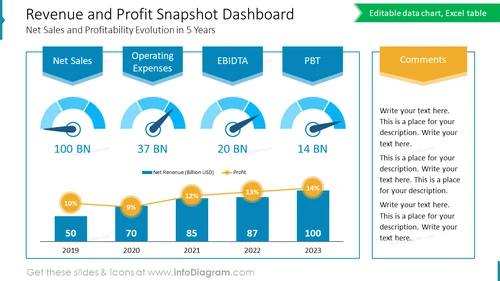
Revenue and Profit Snapshot Dashboard
On this PPT slide, the focus is on delivering a snapshot of a company's financial performance, specifically tracking net sales and profitability over a five-year period. This infographic slide would be a key component in a financial review presentation, used to quickly convey trends in revenue and profits to stakeholders, analysts, or investors during financial updates or strategic planning sessions.
What Does This Revenue and Profit Snapshot Dashboard Include?
- Four gauges with pointers indicating different financial metrics
- An Excel-driven bar chart at the bottom depicting net revenue over five years, with growth percentages
- A comments box in a contrasting color for additional notes
- Header ribbons above the gauges with titles
- Editable tags on the bar chart indicating year-on-year profit percentages


