Financial Decks
Visualize your results with ease
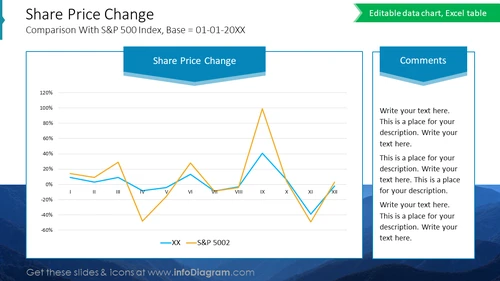
Share Price Change
from deck
Listed Company Financial Report Presentation (PPT Template)
Info
Share Price Change
This PPT Slide Graphically Represents A Company's Share Price Movements Against The S&P 500 Over The Last Year, Offering Insight Into Relative Performance And Market Trends. It Is An Essential Tool For Financial Analysts And Investors To Assess Share Value Changes And Make Informed Decisions Based On Comparative Analysis. The Slide Uses A Line Chart For Visual Clarity And Ease Of Understanding.
What Does This Share Price Change Include?
- Two overlapping Excel-driven editable line graphs for visual comparison
- Color-coded lines for easy distinction between the company and S&P 500 index
- Monthly data points for detailed trend analysis
- A designated comments area for annotations or explanatory notes
- Clearly defined axes with labels for months and percentage values


