Financial Decks
Visualize your results with ease
Share Price Fluctuation
from deck
Listed Company Financial Report Presentation (PPT Template)
Info
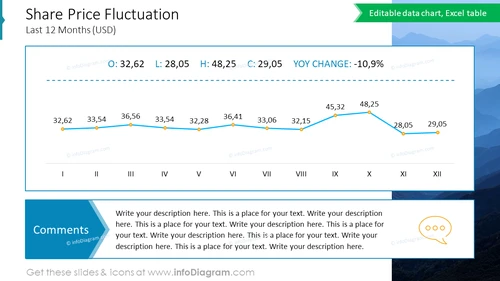
Share Price Fluctuation
This PowerPoint slide displays a 12-month share price trend with high, low, and close values, reflecting market dynamics and investor sentiment. It's useful for financial analysis, investor presentations, and economic forecasting, showcasing trends in share value over time with a clear, informative infographic.
What Does This Share Price Fluctuation Include?
- An Excel-driven editable line graph tracking share prices monthly
- Data points for monthly highs, lows, and closing prices
- A comments section for contextual notes
- A time axis from January to December, indicating monthly performance
- A legend explaining graph elements and data representation


