Financial Decks
Visualize your results with ease
Yearly Earning per Share
from deck
Listed Company Financial Report Presentation (PPT Template)
Info
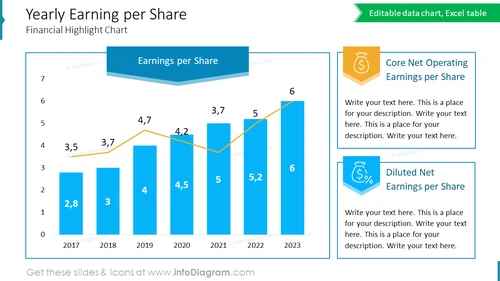
Yearly Earning per Share
This PowerPoint slide presents annual earnings per share over a span of seven years, reflecting company profitability and shareholder value, crucial for assessing financial stability and investment appeal.
What Does This Yearly Earning per Share Include?
- An Excel-driven editable bar chart showing yearly earnings from 2017 to 2023
- A trend line indicating growth over the period
- Annotations for core and diluted earnings per share
- Color-coded components for easy visual digestion
- Exact numerical values for detailed data review


