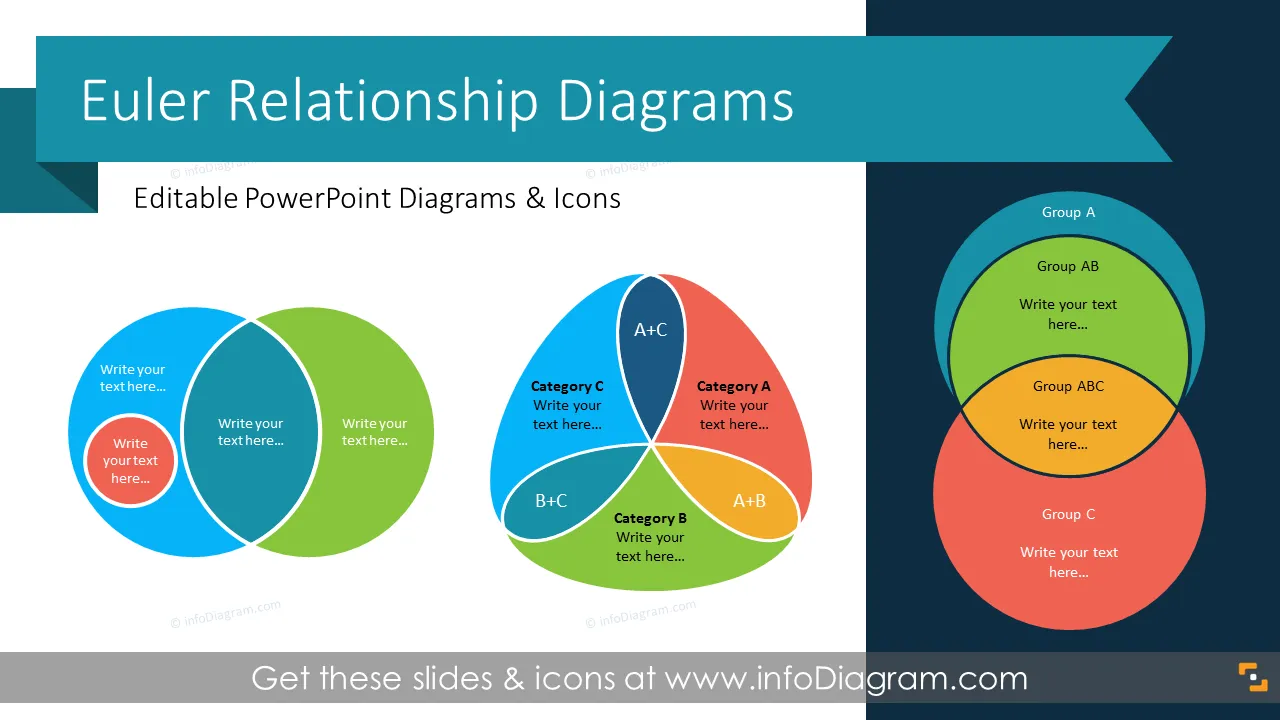
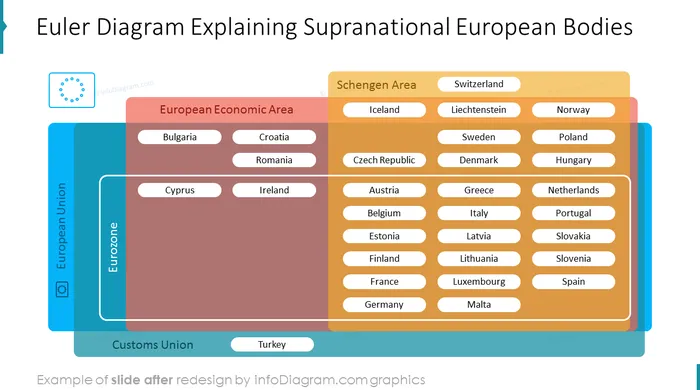
What is an Euler Diagram?
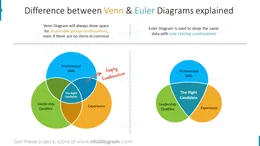
An Euler diagram is a visual way to present relations among objects by drawing a set of shapes (circles, ovals, rectangles). The location of shapes represents relationships among several parameters or variables. They are similar to Venn diagrams, however, the Euler diagram presents only relevant relationships, while Venn diagrams show all possible overlapping possibilities. Euler diagrams are particularly useful for explaining complex hierarchies and overlapping definitions. By this visualization method, you represent exclusion, containment, and the intersection of sets in an intuitive manner.
Why use the Euler Diagram in MS Office PowerPoint?
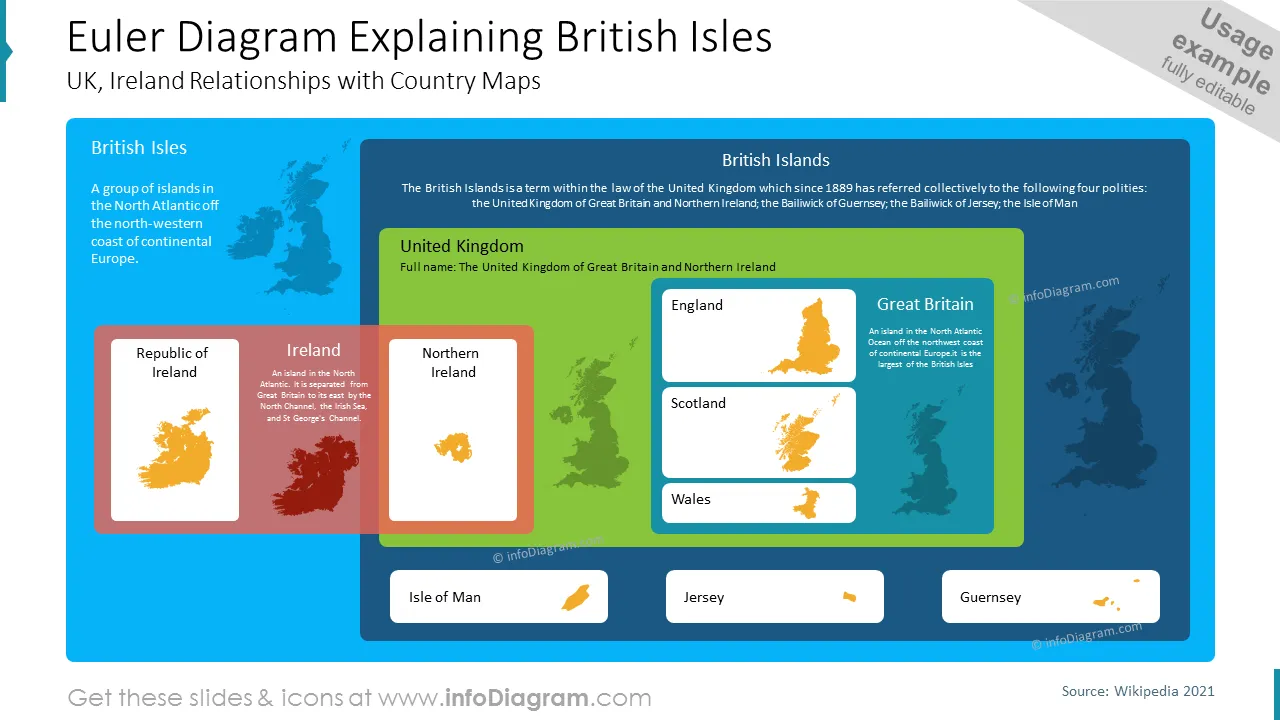
If you need to show relationships between various concepts or elements in your business report or presentation use our predesigned Euler diagrams. You can visualize large databases involving multiple classifications. Euler diagrams will help you include, exclude, and intersect results in simple visual schematics supporting your analysis and conclusions that may be evaluated by the audience.
You can reuse our predesigned Euler diagrams and tailor them to your needs to upgrade your presentation. The majority of our templates have a space for your text/comments, so it is very easy to extend the presented ideas. We also include detailed instructions on how to alter the content, colors, look, and feel of the slides.
Where can you use the Euler Diagrams presentation deck?
Using Euler diagrams will help you organize information in a logical and good-looking way via powerful visualization.
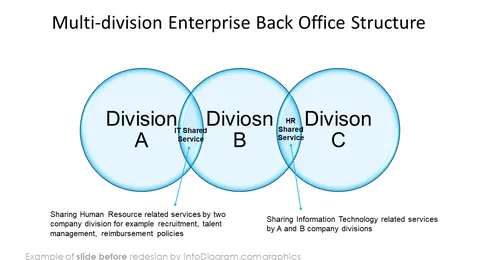
- Present multi-division enterprise with shared back-office structures
- Illustrate common values for brands under the same mother company, intersecting shared customer promises
- Describe the right candidate features defined in the recruitment process
- Show 3 essential criteria for your office location, including one predominant determinant
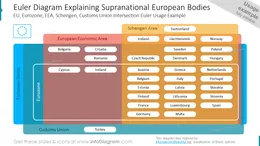
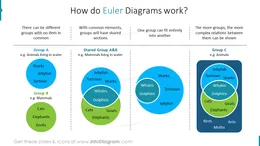
- Explain relationships between 3 or 5 categories using overlapping circles or ovals
- Design 3 or 5 sets of diagrams with distinctive inclusions, exclusions, and intersections, comprising disjoint groups and groups with common parts
- Show 3 sets diagram with common groups and without shared part for all 3 sets
Try using those PowerPoint illustrations to present your content visually in an elegant way.
All graphics are editable, so you can modify the colors and text. We also added a general icon collection at the end of the presentation deck. Optionally you can also extend the collection by more PPT symbols (see Related Diagrams section).
Fully editable in PowerPoint set of vector shapes fully editable by using built-in PowerPoint tools, including
- change the color of all shapes filling and their outline, including icons
- adding shadows
- changing shape and size, rotating, flipping the object
- putting shapes behind or on top of text
See editing demonstration in our HowTo Videos.
Authors
- Design by infoDiagram's designer.
Contact: here