Financial Decks
Visualize your results with ease
2x2 Dashboard Slide Layout
from deck
Dashboard Layouts for Executive Data Report Presentation (PPT Template)
Info
2x2 Dashboard Slide Layout
Slide Content
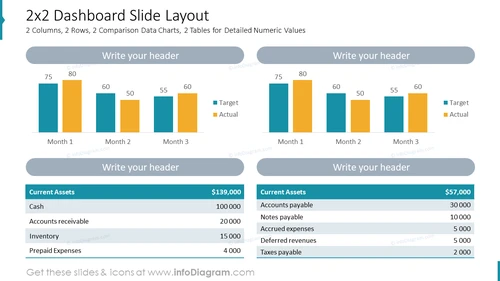
The slide presents a 2x2 Dashboard Slide Layout which includes 2 columns, 2 rows, comparison data charts, and tables for detailed numeric values. There are two bar charts, each corresponding to a different set of data over three months comparing 'Target' versus 'Actual' values. In addition, each chart is accompanied by a table below it, listing various financial figures such as 'Current Assets', 'Cash', 'Accounts receivable', 'Inventory', and 'Prepaid Expenses' along with their respective numeric values.
Graphical Look
- The slide uses a professional color palette with shades of blue and orange for the charts and a light gray for table headers and footers.
- Two horizontal bar charts, each with two bars per month for three months—colors differentiate 'Target' (blue) and 'Actual' (orange).
- Two tables located under each chart with a gray header containing placeholders for text.
- Numbers above the bars on the charts indicate the quantitative value associated with each.
- Text placeholders for inserting a header above each chart and each table, as well as for a concluding comment or summary below the tables.
The overall look is clean and corporate, geared towards easy comparison of data over time with a focus on clarity and straightforward presentation.
Use Cases
- To showcase financial performance metrics, comparing actual results against targets in monthly business reviews.
- For management meetings to discuss departmental or project budgets and expenditure tracking.
- In sales presentations when comparing sales targets to actual sales figures over a period.
- Using it as part of a larger business plan or proposal to visually represent financial forecasts and achievements.


