Financial Decks
Visualize your results with ease
5 elements key diagram shown with place textholders on the side
from deck
Key Shape Solution Diagrams (PPT Template)
Info
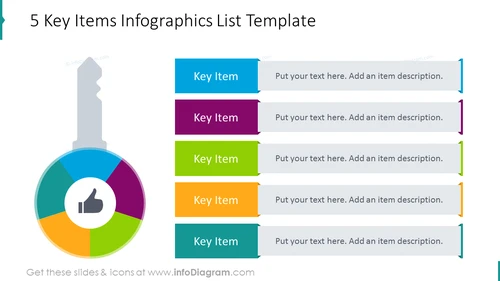
5 Key Items Infographics List Template
Slide Content
This PowerPoint slide is titled "5 Key Items Infographics List Template" and is designed to showcase a list of five key items, each with a space for a descriptive text. These items are color-coded to match segments of a pie chart in the center of the slide, which includes a symbolic thumbs-up icon in the middle. This layout is typically used to present interconnected ideas or components in a visually cohesive and organized manner.
Graphical Look
- The slide background is white, creating a clean and minimalistic look.
- There is a central pie chart with five colored segments, each segment corresponds to one of the key items listed on the right side of the slide.
- Inside the pie chart, there is a gray thumbs-up icon symbolizing positive feedback or approval.
- To the right of the pie chart, there are five rectangular shapes, each with a different color matching the pie chart segments (blue, purple, green, orange, cyan).
- Each rectangular shape contains the text "Key Item" in bold and a placeholder text "Put your text here. Add an item description."
- The rectangles have a small right-angled triangle at their right edge, pointing towards the pie chart, visually connecting the text boxes to the chart segments.
- A subtle shadow effect is applied to both the pie chart and the rectangles giving a slight three-dimensional appearance.
The overall look of the slide is modern and professional, with a clear structure that highlights the correlation between the text items and the graphical elements. The use of color coordination between the pie chart and text boxes makes the design visually appealing and easy to follow.
Use Cases
- To present a business strategy or plan by outlining five key components or steps and explaining each in detail.
- Highlighting the top priorities or goals for a project, with each section detailing particular objectives and actions.
- Breaking down a product's key features or benefits and associating each feature with a segment of the pie chart for easier understanding.
- Summarizing research findings or survey results by pairing the quantitative representation in the pie chart with qualitative explanations in the text boxes.


