Your graphics add a nice touch to my presentations and I recently used them for one of my all-hands meetings. Your toolbox adds professionalism to my slides. Instead of using standard clipart.
Claude Jones, Director of Engineer, @Walmartlabs, USA
Your graphics add a nice touch to my presentations and I recently used them for one of my all-hands meetings. Your toolbox adds professionalism to my slides. Instead of using standard clipart.
Claude Jones, Director of Engineer, @Walmartlabs, USA
I needed a fresh look at some of my slides. I've tried to find a way to create a paintbrush effect, to underline, accentuate, add some color and the handwritten markers were just the things. Very easy to use, easy to size, change the color. It was an affordable, perfect solution and I'm happy to recommend it.
Anonymous, US
The crisp, clean look of the graphics, and the fact that it allowed me to easily edit and change the colors to match the template was my main reason for purchasing them.
Brandie Jenkins, E-learning Developer, USA
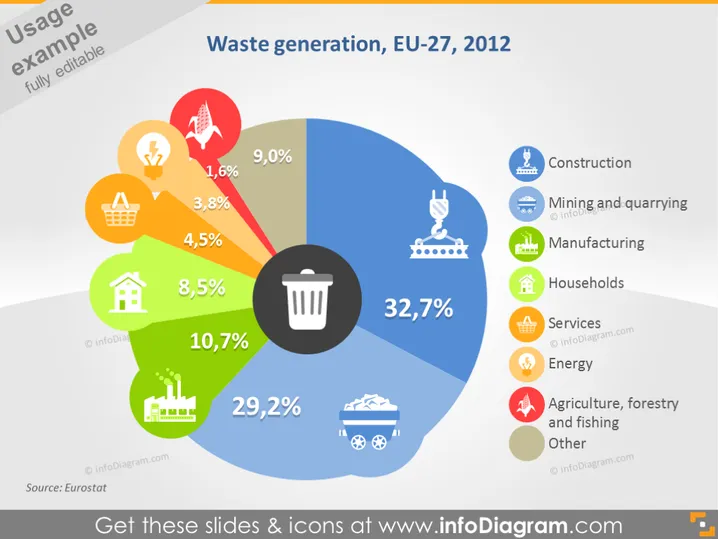
The slide presents the statistics of waste generation in EU-27 countries for the year 2012. A pie chart in the center breaks down the waste generation by sectors. The largest sector is Manufacturing at 29.2%, followed by Households at 10.7%, Services at 8.5%, Energy at 3.8%, and Construction at 1.6%. Other significant contributions come from Mining and quarrying at 9.0%, Agriculture, forestry, and fishing at 4.5%, and an 'Other' category at 32.7%. Each percentage indicates the contribution of that sector to the total waste generated.
The overall look of the slide is clean and colorful, with visual elements facilitating the understanding of the waste generation data. The usage of representative icons and color coordination makes the data accessible and straightforward to grasp at a glance.




