Your graphics add a nice touch to my presentations and I recently used them for one of my all-hands meetings. Your toolbox adds professionalism to my slides. Instead of using standard clipart.
Claude Jones, Director of Engineer, @Walmartlabs, USA
Your graphics add a nice touch to my presentations and I recently used them for one of my all-hands meetings. Your toolbox adds professionalism to my slides. Instead of using standard clipart.
Claude Jones, Director of Engineer, @Walmartlabs, USA
I needed a fresh look at some of my slides. I've tried to find a way to create a paintbrush effect, to underline, accentuate, add some color and the handwritten markers were just the things. Very easy to use, easy to size, change the color. It was an affordable, perfect solution and I'm happy to recommend it.
Anonymous, US
The crisp, clean look of the graphics, and the fact that it allowed me to easily edit and change the colors to match the template was my main reason for purchasing them.
Brandie Jenkins, E-learning Developer, USA
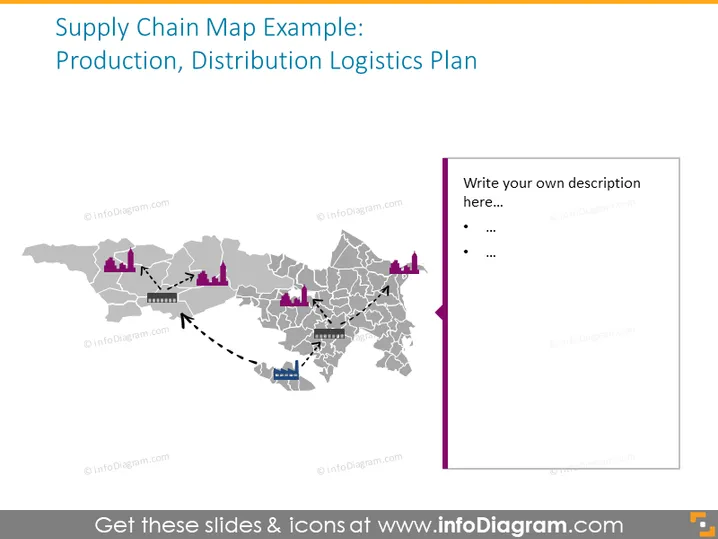
The slide depicts a visual representation of a supply chain on a geographical map, indicating the flow of goods from production to distribution. It includes factories, warehouses, and different modes of transport, showing the complexity and interconnected nature of logistics in business. Each location symbolizes a critical node in the supply chain, such as production plants, distribution centers, or shipping hubs, and the arrows demonstrate the direction of goods movement, providing insight into the supply chain's structure and logistics pathways.
The slide presents a clean and straightforward design with a color scheme that highlights the important aspects of the supply chain. The choice of icons and directional lines clearly conveys the flow of goods within the logistical network.


