Your graphics add a nice touch to my presentations and I recently used them for one of my all-hands meetings. Your toolbox adds professionalism to my slides. Instead of using standard clipart.
Claude Jones, Director of Engineer, @Walmartlabs, USA
Your graphics add a nice touch to my presentations and I recently used them for one of my all-hands meetings. Your toolbox adds professionalism to my slides. Instead of using standard clipart.
Claude Jones, Director of Engineer, @Walmartlabs, USA
I needed a fresh look at some of my slides. I've tried to find a way to create a paintbrush effect, to underline, accentuate, add some color and the handwritten markers were just the things. Very easy to use, easy to size, change the color. It was an affordable, perfect solution and I'm happy to recommend it.
Anonymous, US
The crisp, clean look of the graphics, and the fact that it allowed me to easily edit and change the colors to match the template was my main reason for purchasing them.
Brandie Jenkins, E-learning Developer, USA
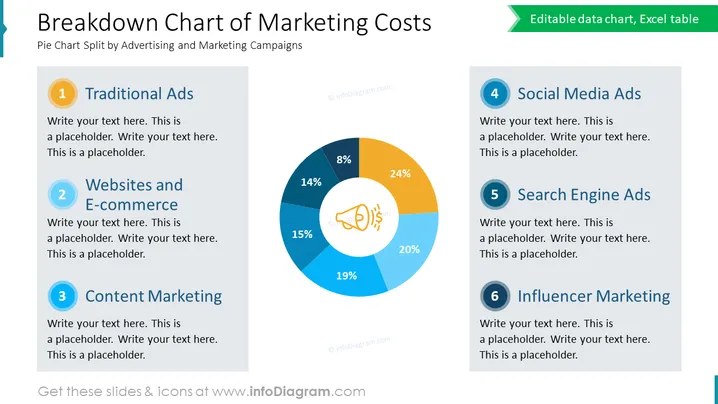
The slide is a visual representation of the distribution of marketing costs across six categories. The categories include: Traditional Ads, Websites and E-commerce, Content Marketing, Social Media Ads, Search Engine Ads, and Influencer Marketing. These categories are meant to provide insight into where a company's advertising budget is being spent—with Traditional Ads and Influencer Marketing typically representing older and newer marketing channels, respectively. Each category is accompanied by a placeholder for additional text, suggesting the slide is customizable according to specific data or discussion points.
The slide has a professional and crisp appearance that efficiently conveys information through the use of color and simple graphics. The design facilitates quick interpretation of data and easy customization for various presentations.


