Your graphics add a nice touch to my presentations and I recently used them for one of my all-hands meetings. Your toolbox adds professionalism to my slides. Instead of using standard clipart.
Claude Jones, Director of Engineer, @Walmartlabs, USA
Your graphics add a nice touch to my presentations and I recently used them for one of my all-hands meetings. Your toolbox adds professionalism to my slides. Instead of using standard clipart.
Claude Jones, Director of Engineer, @Walmartlabs, USA
I needed a fresh look at some of my slides. I've tried to find a way to create a paintbrush effect, to underline, accentuate, add some color and the handwritten markers were just the things. Very easy to use, easy to size, change the color. It was an affordable, perfect solution and I'm happy to recommend it.
Anonymous, US
The crisp, clean look of the graphics, and the fact that it allowed me to easily edit and change the colors to match the template was my main reason for purchasing them.
Brandie Jenkins, E-learning Developer, USA
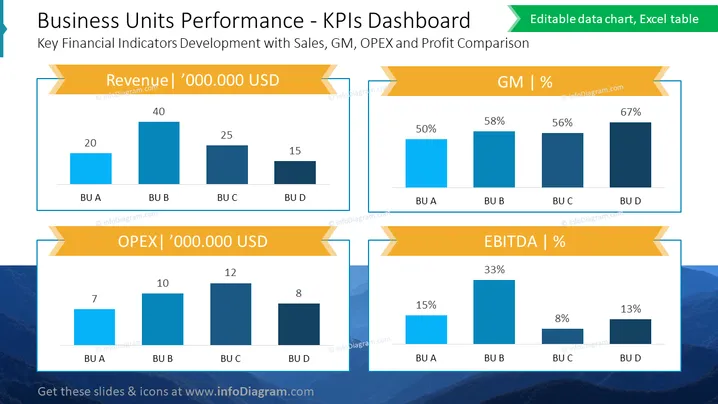
##Business Units Performance - KPIs Dashboard
This PowerPoint slide is a detailed dashboard designed to present a comprehensive view of a company's business units' performance using key financial indicators. It displays metrics such as sales, gross margin (GM), operating expenses (OPEX), and EBITDA in an easily interpretable format, suitable for corporate financial reviews and strategy meetings to assess and compare the performance of different segments within the organization.
##What Does This Business Units Performance - KPIs Dashboard Include?
##This Business Units Performance - KPIs Dashboard is a part of our Listed Company Financial Report Presentation PPT Template.


